$15.4 Billion of New Cryptocurrency Value Was Created During2018

$15.4 Billion of New Cryptocurrency Value Was Created During 2018

Markets and Prices

A report recently published by Diar has estimated that nearly $15.42 billion of value was added to the market capitalization of the combined cryptocurrency markets in the form of newly created tokens and crypto asset inflation during 2018.

Also Read: Bitcoin Climbs up China’s First Crypto Ranking of 2019

12 Percent of Current Crypto Market Cap Was Created During 2018

According to Diar’s report, new crypto asset value created during 2018 is estimated to comprise more than 12 percent of the current combined cryptocurrency market cap.

The largest contribution to newly created value during 2018 was new token additions, representing $4.96 billion, or 32 percent of the $15.42 billion that was added to the markets last year.

$15.4 Billion of New Cryptocurrency Value Was Created During 2018

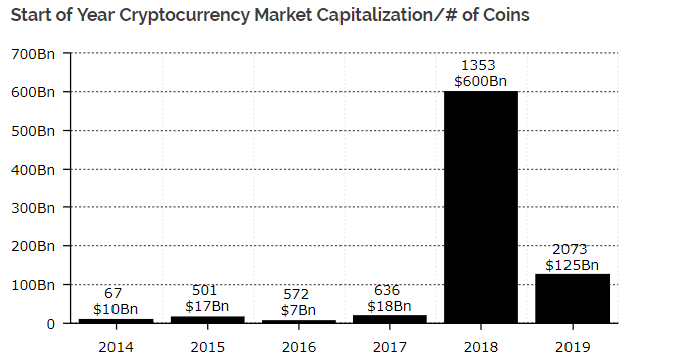
More than 700 new crypto assets entered into circulation during 2018, a more than 50 percent increase when compared with the start of 2018, and an addition of 110 percent of the number of circulating cryptocurrencies as of the start of 2017.

BTC and ETH Added 27 Percent of Newly Created Value Last Year

BTC added roughly $2.63 billion to the combined crypto asset market cap during 2018, with inflation and newly mined BTC comprising 17 percent of new value added to the cryptocurrency markets, forming the largest contribution made by a single virtual currency.

New value created in the form ETH comprised the second largest contribution from a single market to the combined cryptocurrency capitalization during 2018, adding $1.55 billion, or 10 percent of new value.

$15.4 Billion of New Cryptocurrency Value Was Created During 2018

Inflation on all other cryptocurrency tokens that were circulating as of the start of 2018 added a further $4.17 billion to the combined market cap, comprising 27 percent of last year’s newly created crypto asset value.

Burned Tokens Removed $195 Million From Combined Market Cap in 2018

Newly issued stablecoins comprised a significant contribution to the cryptocurrency market cap, adding more than $1.26 billion in value. The BSV fork also comprised a notable source of new crypto asset value, adding $1.04 billion to the combined cryptocurrency market cap.

$15.4 Billion of New Cryptocurrency Value Was Created During 2018

Finally, burned tokens comprised $195 million in value that was removed from the combined cryptocurrency market cap during 2018.

Are you surprised that $15.4 billion of last year’s newly created cryptocurrency value survived to see 2019? Share your thoughts in the comments section below!


Images courtesy of Shutterstock, Diar


At Bitcoin.com there’s a bunch of free helpful services. For instance, have you seen our Tools page? You can even lookup the exchange rate for a transaction in the past. Or calculate the value of your current holdings. Or create a paper wallet. And much more.

Markets Update: BCH Up Over 100% in a Week, BTC Breaks Above$4,000

Markets Update: BCH Up Over 100% in a Week, BTC Breaks Above $4,000

Market Updates

The cryptocurrency markets appear poised to post the strongest week of trading in months, with BCH up over 115% since Dec. 16. BTC is also on the cusp of posting its strongest weekly candle since February after breaking above $4,000.

Also Read: Russian Parliament Postpones Adoption of Digital Assets Bill

BCH Price Doubles in One Week

As of this writing, bitcoin cash (BCH) has posted the strongest percentage daily performance of the top 90 cryptocurrencies by market capitalization, with a 24-hour gain of over 35%. This rally has been driven by the third-strongest daily volume in the history of Bitstamp’s BCH market.

Markets Update: BCH Up Over 100% in a Week, BTC Breaks Above $4,000
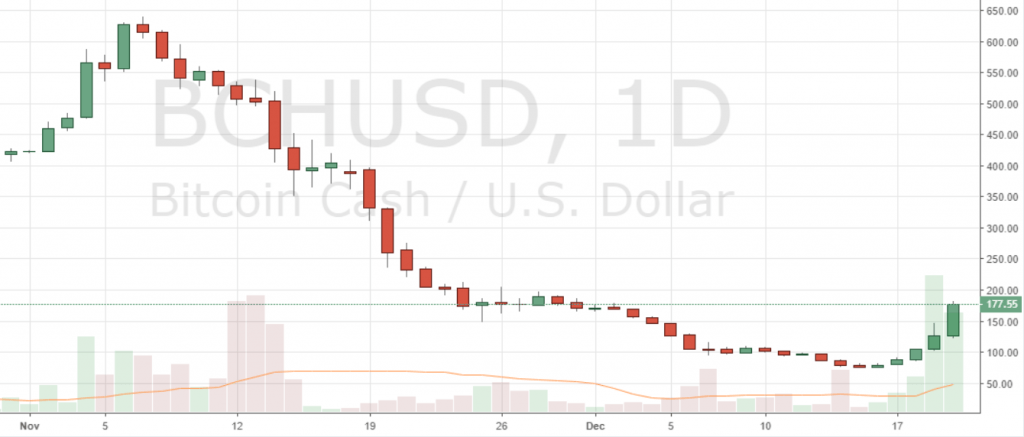
BCH/USD – Bitstamp – 1D

Since posting an all-time low of approximately $73, BCH has gained approximately 132% and is currently trading for around $180. Bitcoin cash has also reclaimed its rank as the fourth-largest cryptocurrency by market cap after languishing at the bottom end of the top 10 just last week.

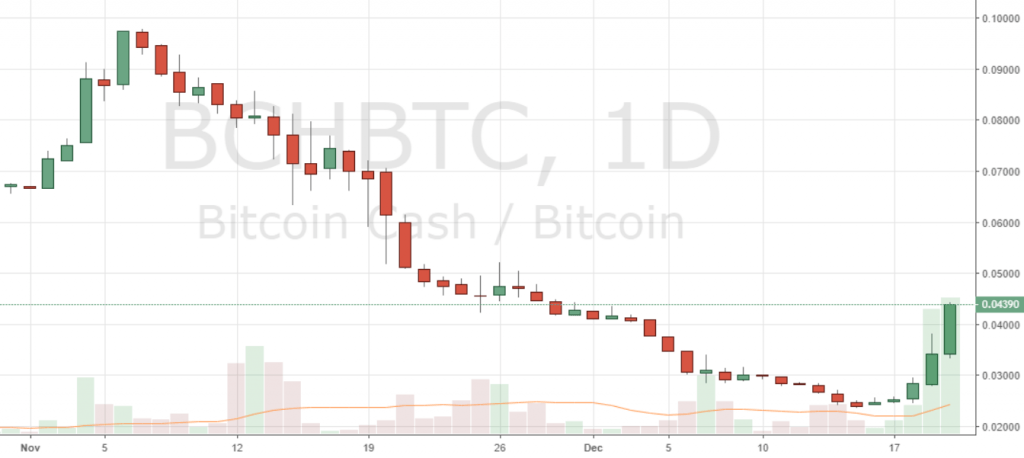
When measuring against BTC, BCH bounced roughly 83% from a record low of approximately 0.024 BTC on Dec. 15 to now trade for 0.0434 BTC, with the last two days comprising the second and third-strongest 24 hours of BCH/BTC trading on Bitstamp.

Markets Update: BCH Up Over 100% in a Week, BTC Breaks Above $4,000
BCH/BTC – Bitstamp – 1D

The market capitalization of BCH is currently $2.95 billion, comprising 2.25% of the capitalization of the combined crypto market.

BTC Poised to Post Strongest Weekly Candle Since February

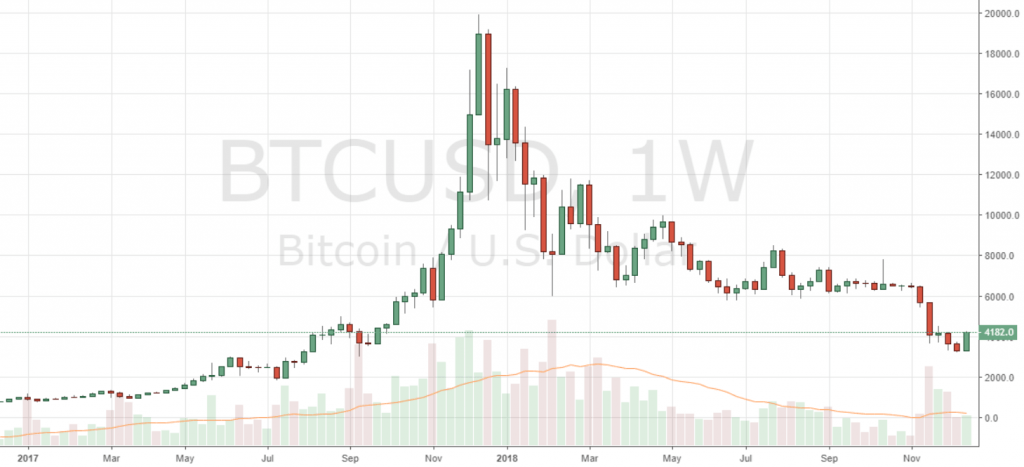
BTC has broken above $4,000 for the first time in 10 days, driven by gains of more than 26% in less than one week. Should BTC close the week with a gain of more than 22%, it will be the strongest seven-day candle posted since Feb. 12.

Markets Update: BCH Up Over 100% in a Week, BTC Breaks Above $4,000
BTC/USD – Bitfinex – 1W

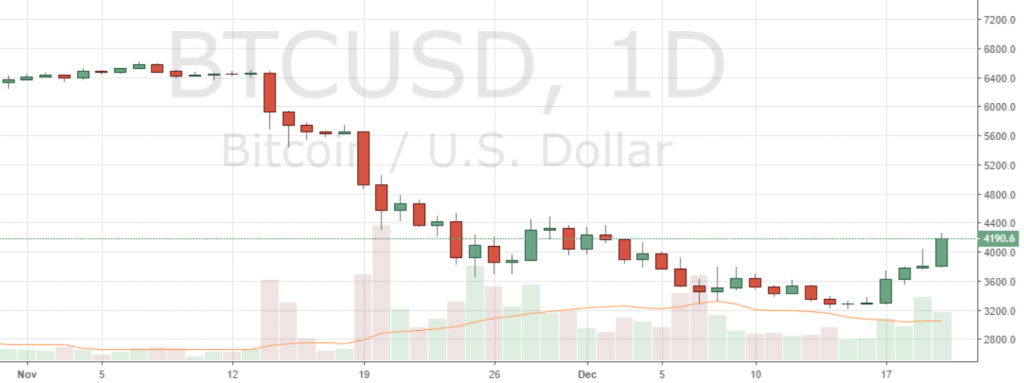
After posting a yearly low of approximately $3,200 on Bitfinex and $3,120 on Bitstamp on Dec. 15, BTC has rallied back above $4,000, posting an intraday top high of $4,200 on Bitfinex and $4,100 on Bitstamp.

Markets Update: BCH Up Over 100% in a Week, BTC Breaks Above $4,000
BTC/USD – Bitfinex – 1D

BTC currently has a market dominance of 54% and total capitalization of $71.15 billion.

XRP Market Cap Over $15 billion

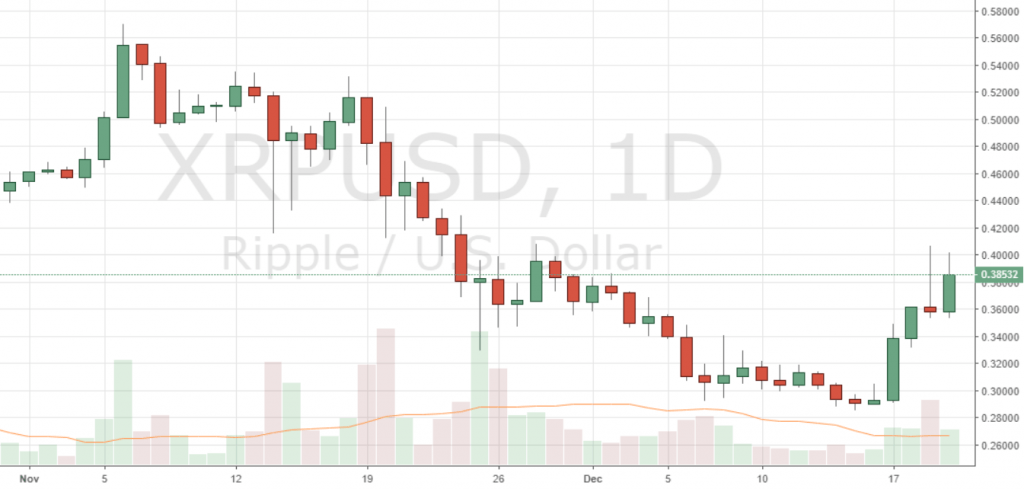
The second largest cryptocurrency by market cap, XRP, has gained roughly 32% in five days, bouncing from approximately $0.3 to currently test resistance at $0.385.

Markets Update: BCH Up Over 100% in a Week, BTC Breaks Above $4,000
XRP/USD – Bitfinex – 1D

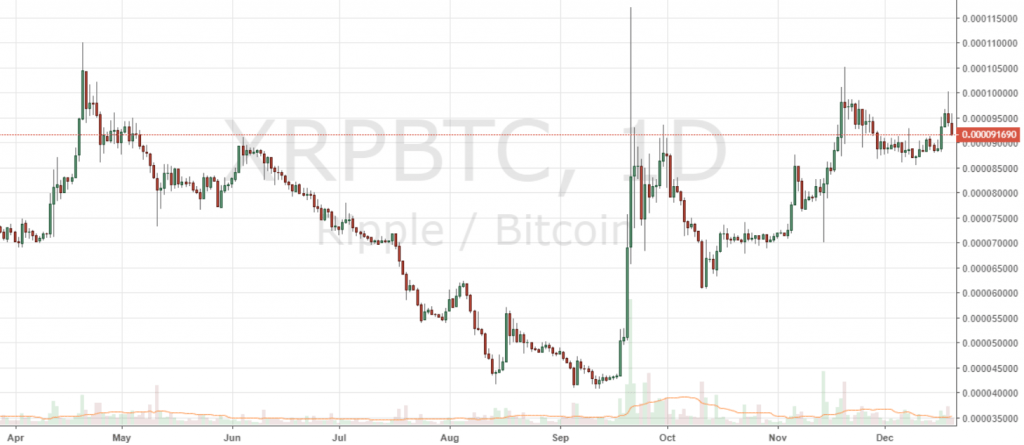
When measuring against BTC, XRP appears to be producing an ascending wedge pattern, with price action consolidating at the neckline area of between roughly 0.00009 BTC and 0.0001 BTC for the past five days.

Markets Update: BCH Up Over 100% in a Week, BTC Breaks Above $4,000
XRP/BTC – Bitfinex – 1D

As of this writing, XRP has a market capitalization of approximately $15.25 billion, comprising 11.6%.

ETH Bounces Back Above $100

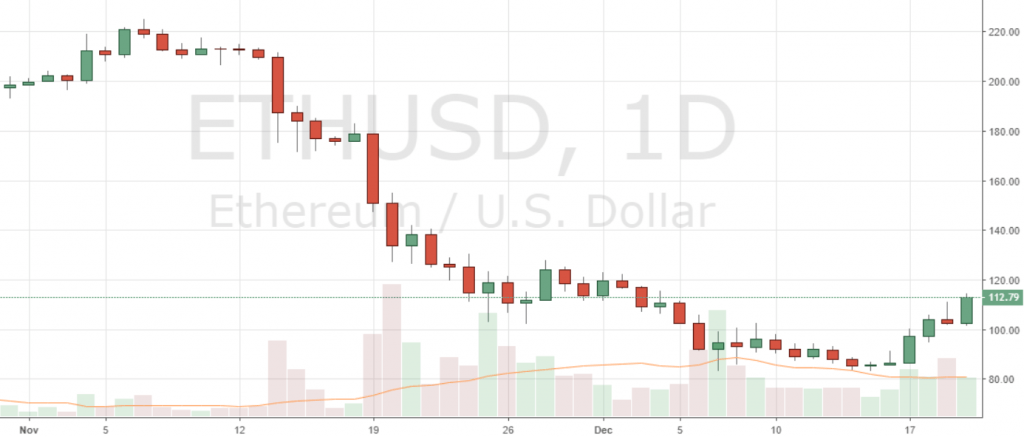
After a year-to-date low of approximately $83, ETH has rebounded 31% in roughly one week to currently trade for $112 at local resistance.

Markets Update: BCH Up Over 100% in a Week, BTC Breaks Above $4,000
ETH/USD – Bitfinex – 1D

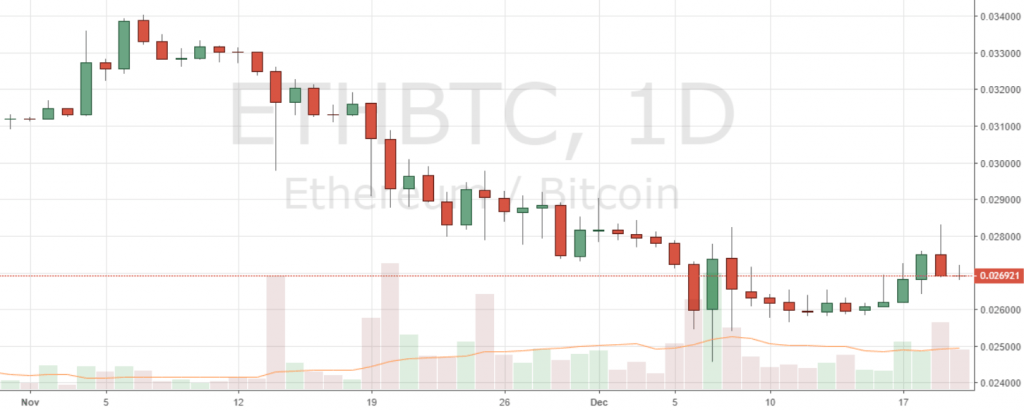
When measuring against BTC, ETH has chopped between approximately 0.025 BTC and 0.028 BTC for the last two weeks, excluding a brief capitulation down to a 2018 low of 0.0245 BTC on Dec. 7.

Markets Update: BCH Up Over 100% in a Week, BTC Breaks Above $4,000
ETH/BTC – Bitfinex – 1D

Ethereum now has a market cap of $11.4 billion and a market dominance of 8.7%.

Do you think that the cryptocurrency markets can continue to rally? Or are lower lows incoming? Share your thoughts in the comments section below!


Images courtesy of Shutterstock, Tradingview


The Bitcoin universe is vast. So is Bitcoin.com. Check our Wiki, where you can learn everything you were afraid to ask. Or read our news coverage to stay up to date on the latest. Or delve into statistics on our helpful tools page.

Despite 2018 Bear Market, Top Crypto Markets HaveOutperformed FANG Stocks Since 2017

Despite 2018 Bear Market, Top Crypto Markets Have Outperformed FANG Stocks Since 2017

Markets and Prices

Despite the 2018 cryptocurrency bear trend renewing gleeful predictions of bitcoin’s demise from mainstream financial analysts, the leading crypto markets have dramatically outperformed the ‘FANG’ (Facebook, Apple, Netflix, and Google) stocks since the start of 2017.

Also Read: Linkedin Names ‘Blockchain Developer’ Top Emerging US Job of 2018

FANG Stocks Up Between 25% and 115% Since Start of 2017

As with the cryptocurrency markets, the FANG stocks broke into new record highs during early 2017, leading to a multi-month bull trend driven by accelerated momentum. However, in spite of currently posting year-to-date losses between 75% and 90%, the leading cryptocurrency markets have significantly outperformed the FANG stocks since the start of 2017.

APPLE

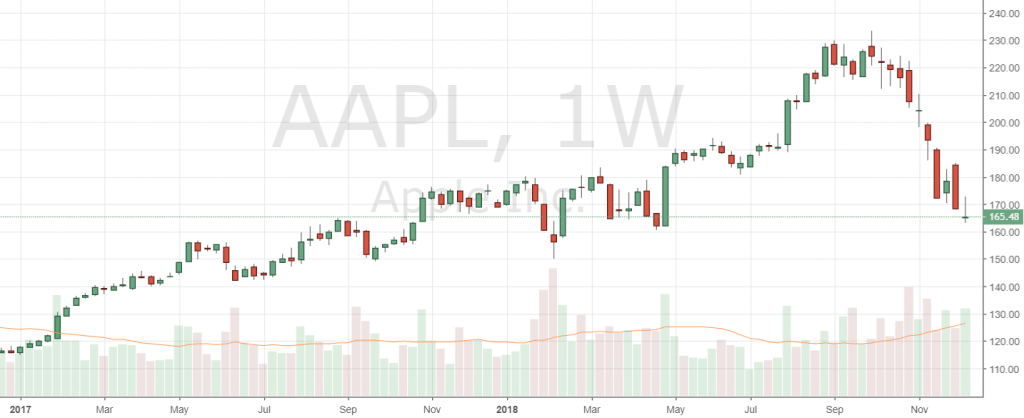
At the start of 2017, AAPL (Apple) was trading for approximately $115. After rallying throughout 2017, APPL continued to set record highs during 2018 before going parabolic in the third quarter following a breakout above $1 trillion in market cap.

Despite 2018 Bear Market, Top Crypto Markets Outperform FANG Stocks Since 2017

Since establishing an all-time high above $230 at the start of October, APPL has aggressively retraced roughly 30% back to currently trade for approximately $165, resulting in the stock having gained approximately 43% since January 2017.

FACEBOOK

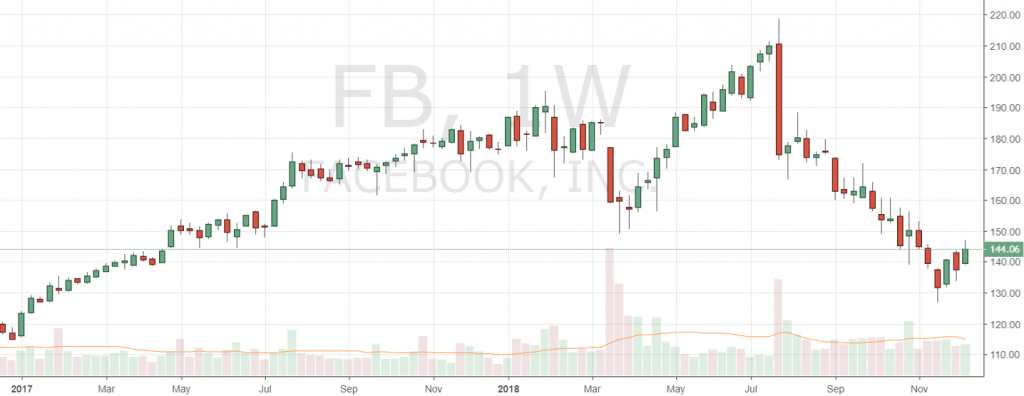
Of the FANG stocks, FB (Facebook) has seen the greatest price volatility in price over the past two years. Trading for approximately $115 at the start of January 2017, FB saw 12 months of predominantly bullish action before producing a roughly 23% retracement from a then-record high of $195 down to $150 during the first quarter of 2018.


Despite 2018 Bear Market, Top Crypto Markets Outperform FANG Stocks Since 2017

The second and third quarters of 2018 saw FB rally to post a record high of nearly $220, before suffering a violent 40% crash to establish local support at $125. As of this writing, FB is trading for $144, equating to a gain of 25% since the start of 2017.

NETFLIX

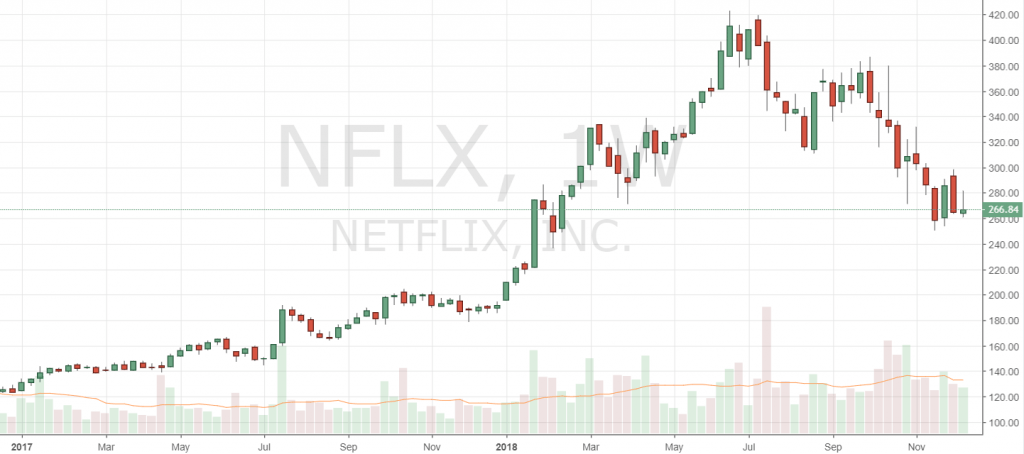
NFLX (Netflix) has been the strongest performing of the FANG stocks since January 2017. NFLX began 2017 trading at nearly $125 before producing 18 months of sustained bullish action.

Despite 2018 Bear Market, Top Crypto Markets Outperform FANG Stocks Since 2017

Since producing a double-top at approximately $420 during June and July, NFLX has recently retraced by roughly 40%. As of this writing, NFLX is consolidating at the $265 support area, resulting in a price gain of 115% in nearly 24 months.

GOOGLE

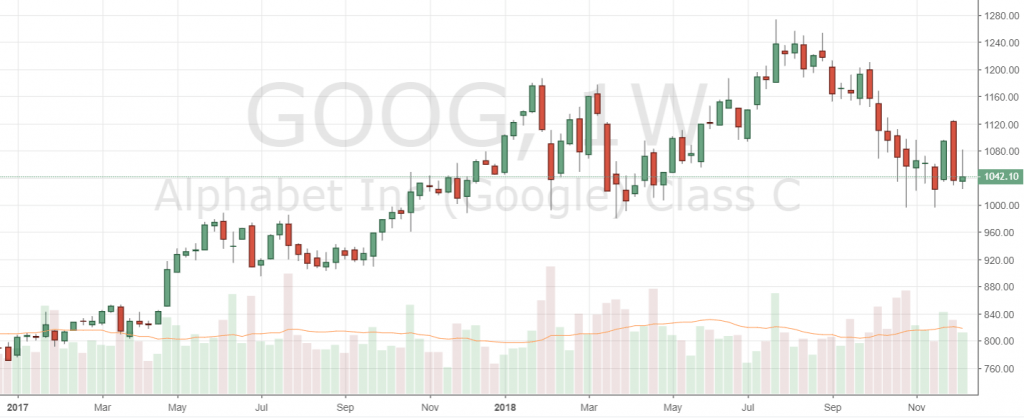
GOOG (Google) has been the least volatile of the FANG stocks in the last 24 months, beginning 2017 at roughly $772. GOOG then produced 19 months of mostly bullish price action, before double-topping at roughly $1,255 during July and August.

Despite 2018 Bear Market, Top Crypto Markets Outperform FANG Stocks Since 2017

GOOG has suffered the smallest losses of the FANG stocks since posting its current all-time high, having retraced nearly 20% to test support at $1,000. GOOG is currently trading for $1,042, equating to a price gain of 35% since January 2017.

Top Crypto Markets Gain Between 200% and 4,000% in 24 Months

At the start of 2017, the top five cryptocurrencies by market cap were BTC, ETH, XRP, LTC, and XMR.

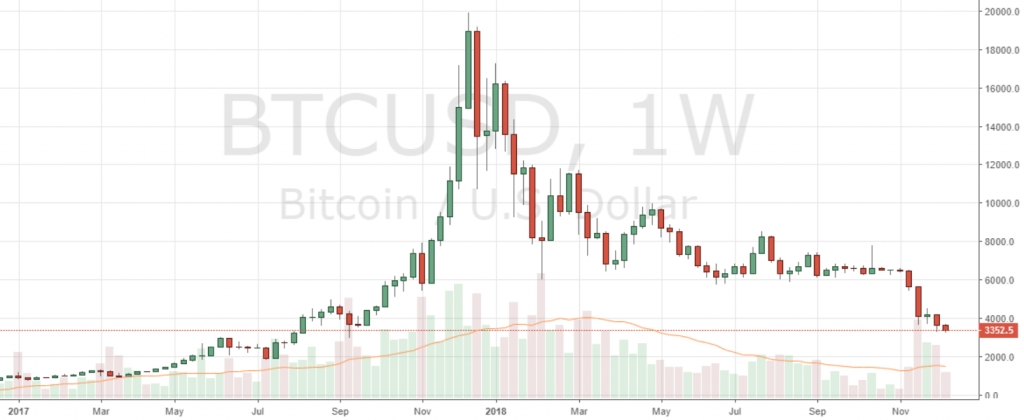
Despite losing nearly 77% since the start of the year, BTC has gained nearly 250% since January 2017, gaining from nearly $965 to currently trade for $3,344.

Despite 2018 Bear Market, Top Crypto Markets Outperform FANG Stocks Since 2017

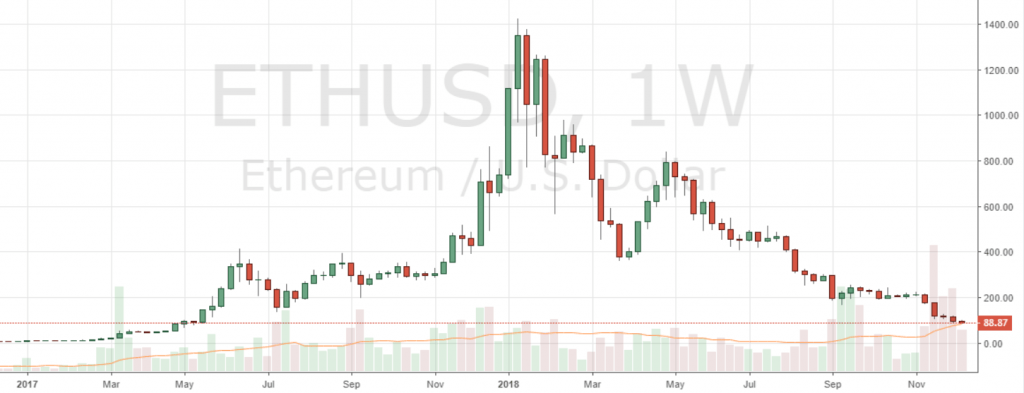
In spite of posting a YTD loss of 88.5% as of this writing, ETH has gained over 1,000% in nearly 24 months, rising from $8 to $88.5.

Despite 2018 Bear Market, Top Crypto Markets Outperform FANG Stocks Since 2017

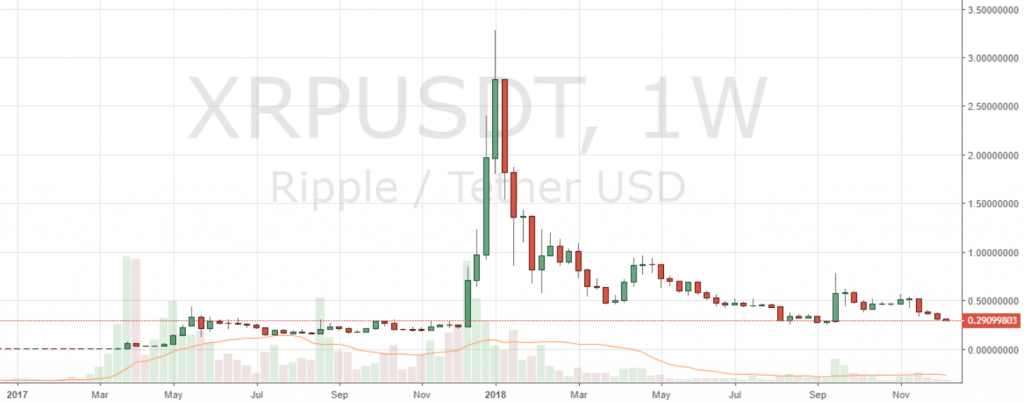
Of the top crypto markets from the start of 2017, XRP has since produced the largest gains, with prices increasing nearly 4,350% from roughly $0.0065 to 0.29 today, despite posting a YTD loss of 87%.

Despite 2018 Bear Market, Top Crypto Markets Outperform FANG Stocks Since 2017

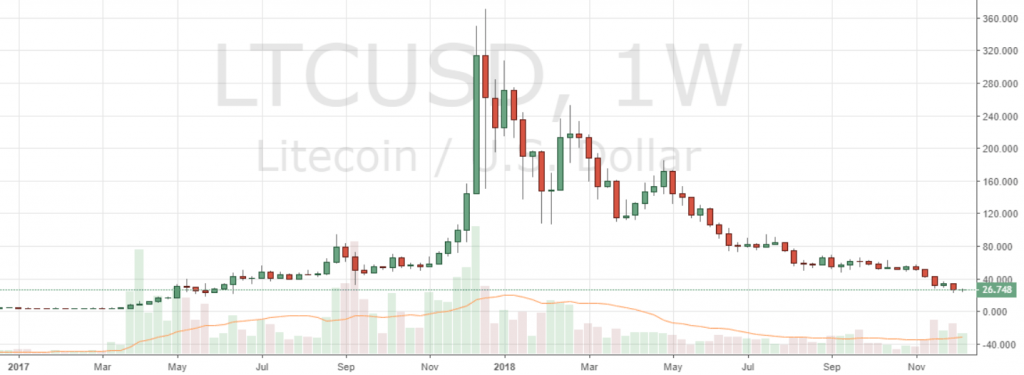
Although LTC has yielded a YTD loss of 90%, the now seventh-ranked cryptocurrency by market cap has still produced price gains of more than 500% since the start of 2017, gaining from $4.33 to $26.5 today.

Despite 2018 Bear Market, Top Crypto Markets Outperform FANG Stocks Since 2017

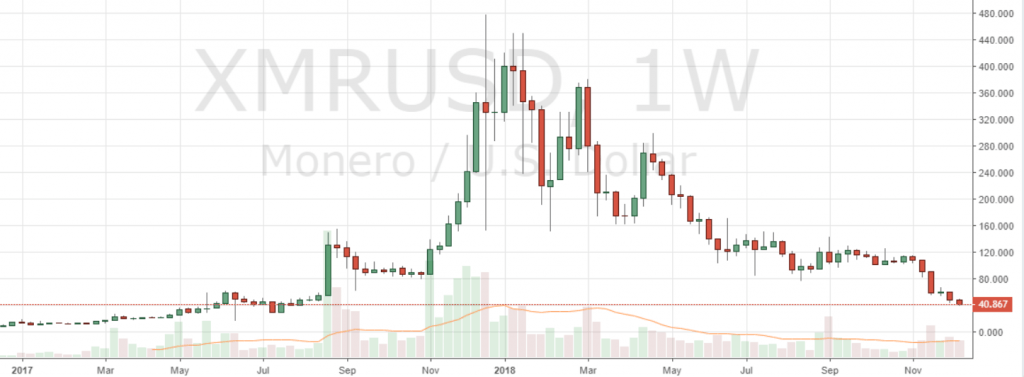
While XMR has slipped to rank 12th by market capitalization and produced a YTD loss of 88.5%, Monero has gained nearly 200% since January 2017, with prices rising from $13.8 to $40.4.

Despite 2018 Bear Market, Top Crypto Markets Outperform FANG Stocks Since 2017

Do you HODL or day-trade? Share your favorite trading strategies in the comments section below!


Images courtesy of Shutterstock, Tradingview


The Bitcoin universe is vast. So is Bitcoin.com. Check our Wiki, where you can learn everything you were afraid to ask. Or read our news coverage to stay up to date on the latest. Or delve into statistics on our helpful tools page.

Markets Update: Bears Continue to Drag Cryptocurrency PricesDown

Markets Update: Bears Continue to Drag Cryptocurrency Prices Down

Market Updates

Digital asset prices have been dipping in value again after a few days of price consolidation. At the moment, the entire cryptocurrency economy is awfully close to dropping under the psychological $100 billion market valuation. Furthermore, since our last markets update cryptocurrency global trade volumes are weaker than usual, with only $11.5 billion worth of assets traded over the last 24 hours.

Also read: Password Manager App Dashlane Mocks Cryptocurrency Owners

More Price Dips and Lower Trade Volumes

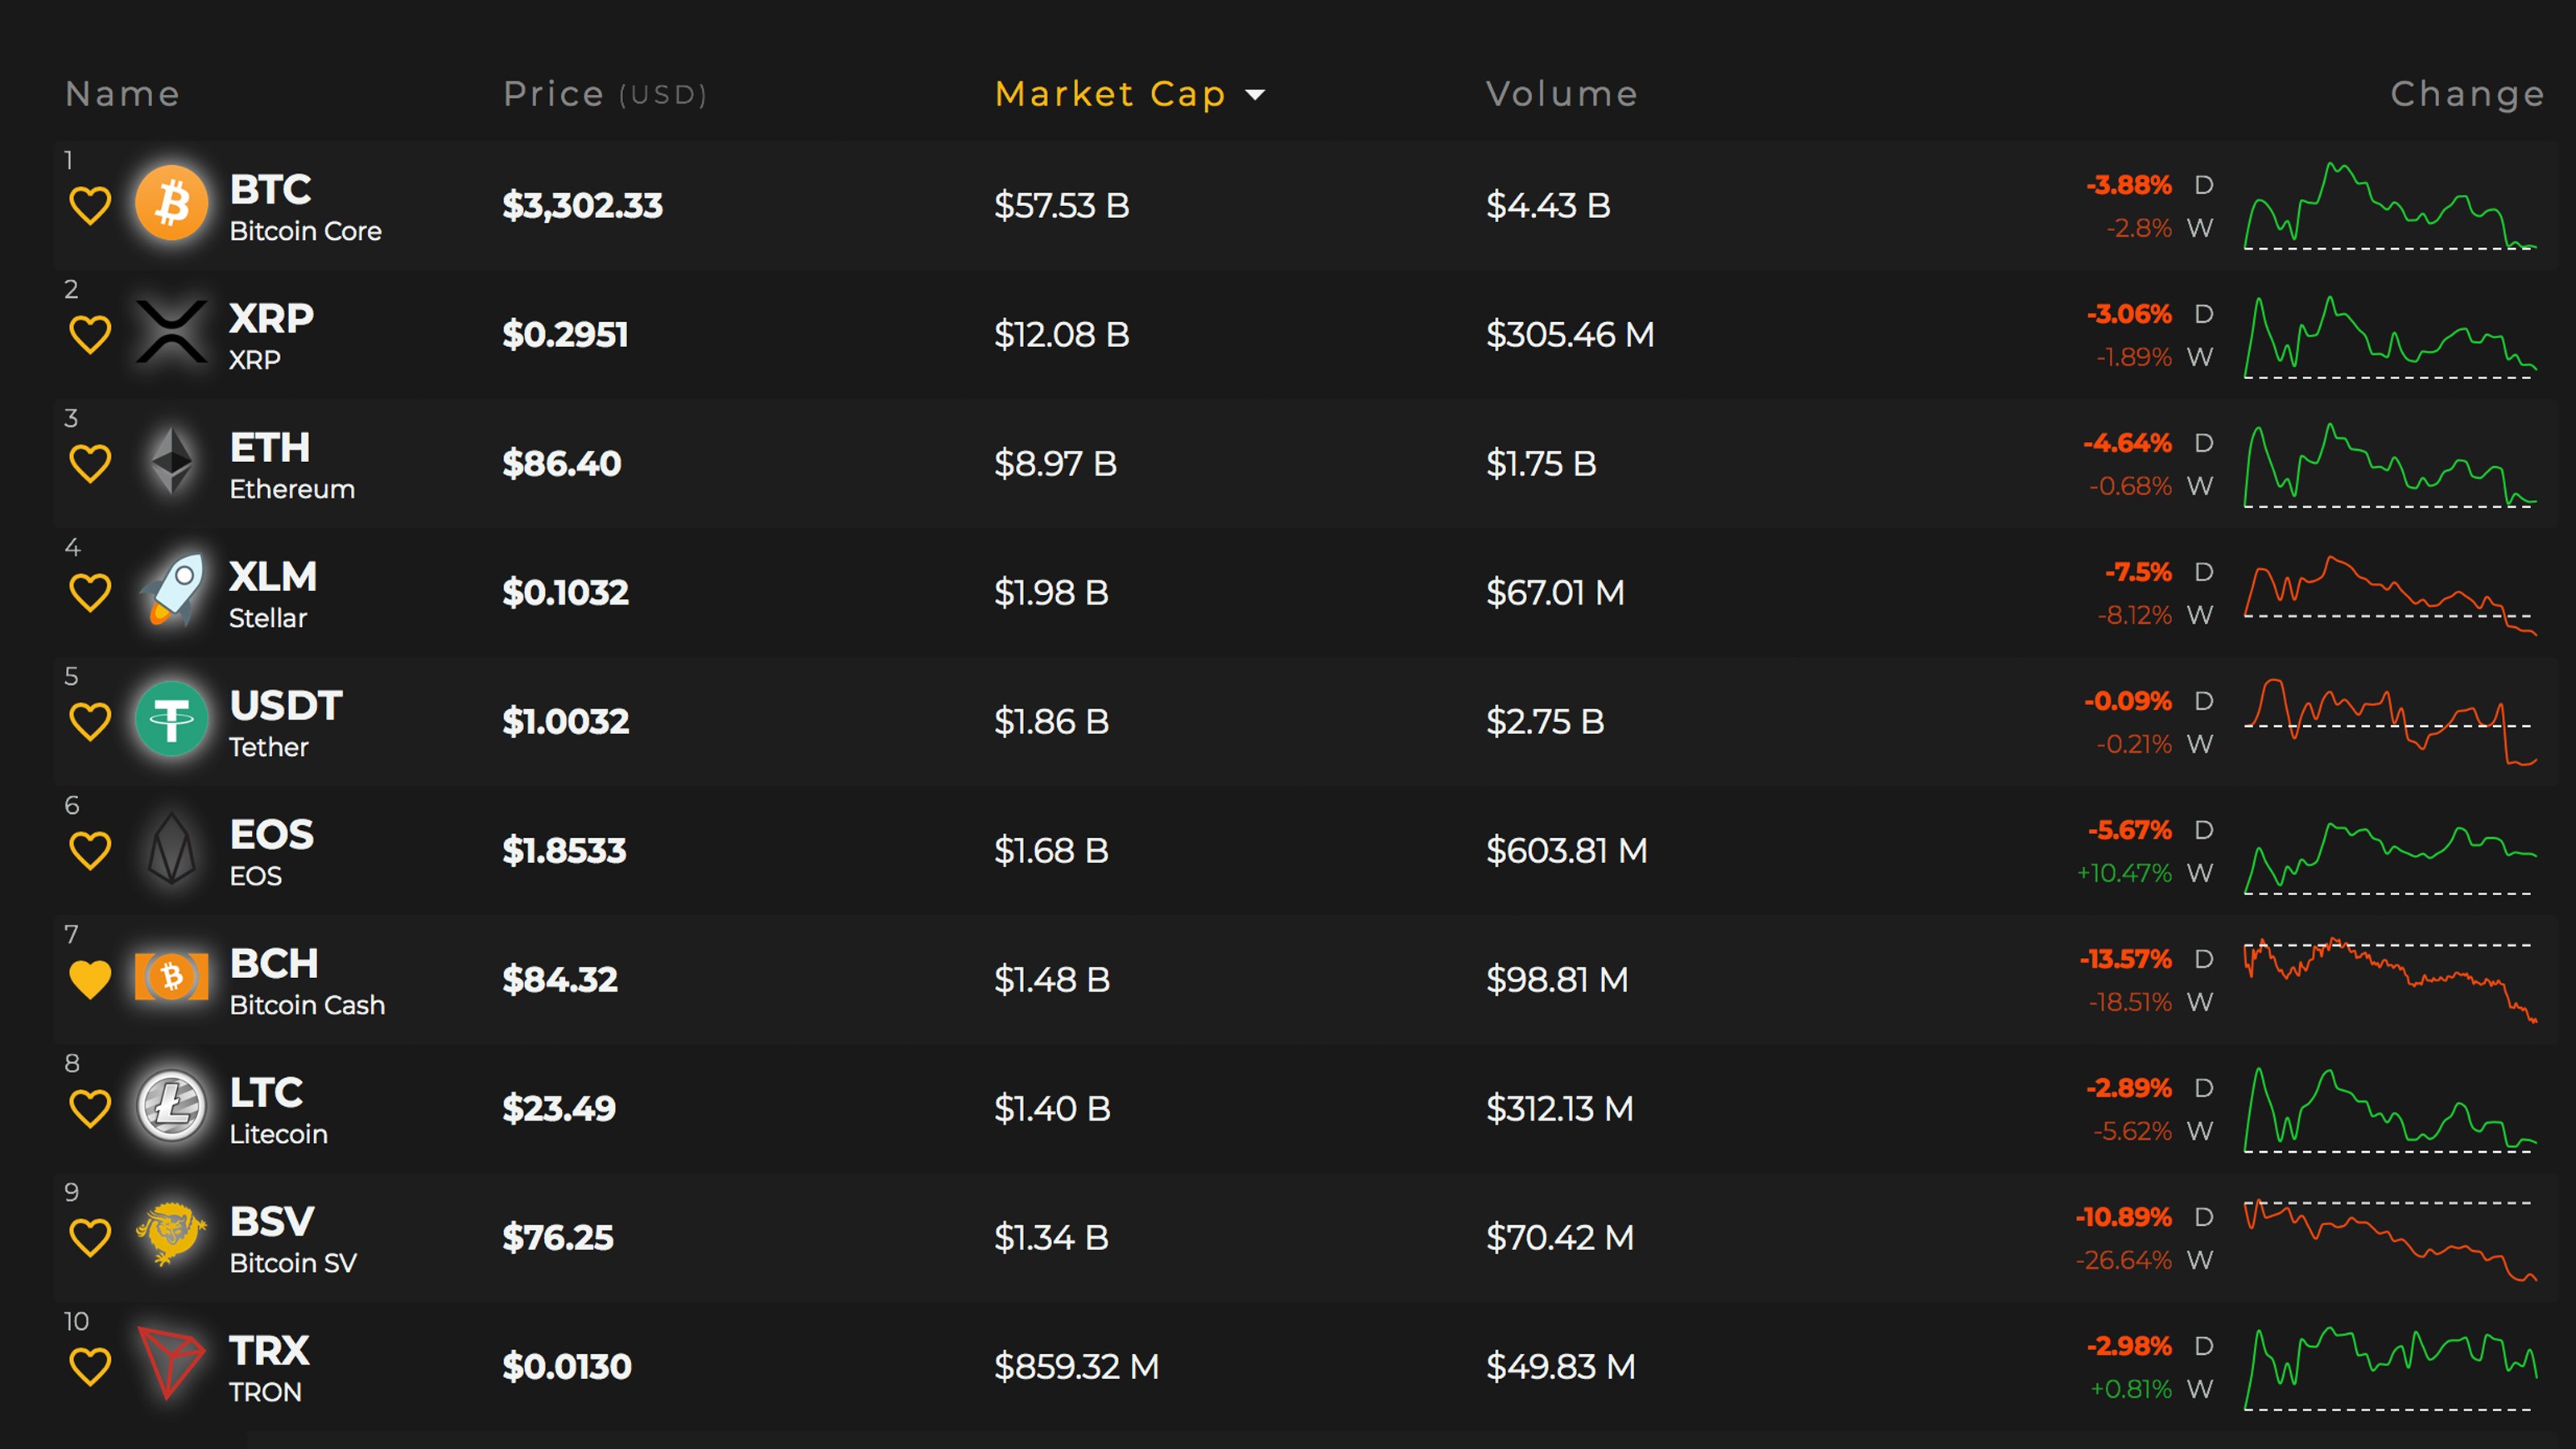
Crypto-market prices are sliding again as the top 10 digital assets have seen 24-hour losses between 2-13%. At the time of publication, the entire market capitalization of all the coins in existence is $104.2 billion today. Currently, bitcoin core (BTC) prices are down 3.8%, on Friday, and 2.8% over the course of the last week. This gives BTC a global average price of about $3,302 and the value is lower on certain exchanges. Moreover, bitcoin core has a market valuation of about $57.5 billion which is 55% dominance over the entire digital asset economy.

Markets Update: Bears Continue to Drag Cryptocurrency Prices Down
Top 10 cryptocurrencies on Dec. 14, 2018.

BTC is followed by ripple (XRP) as the market captures $12 billion and each XRP is being swapped for $0.29 per coin. Ethereum (ETH) holds the third position but markets are down 4.6% and ETH is being traded for $86 per token. Stellar (XLM) takes the fourth position today as each coin is trading for $0.10 a piece. However, XLM markets have lost over 7.5% during the last 24 hours of trading. Lastly, the current ruler of the fifth position is the stablecoin tether (USDT) which is trading for a U.S. dollar and once in a while a few pennies above 1 USD.

Bitcoin Cash (BCH) Market Action

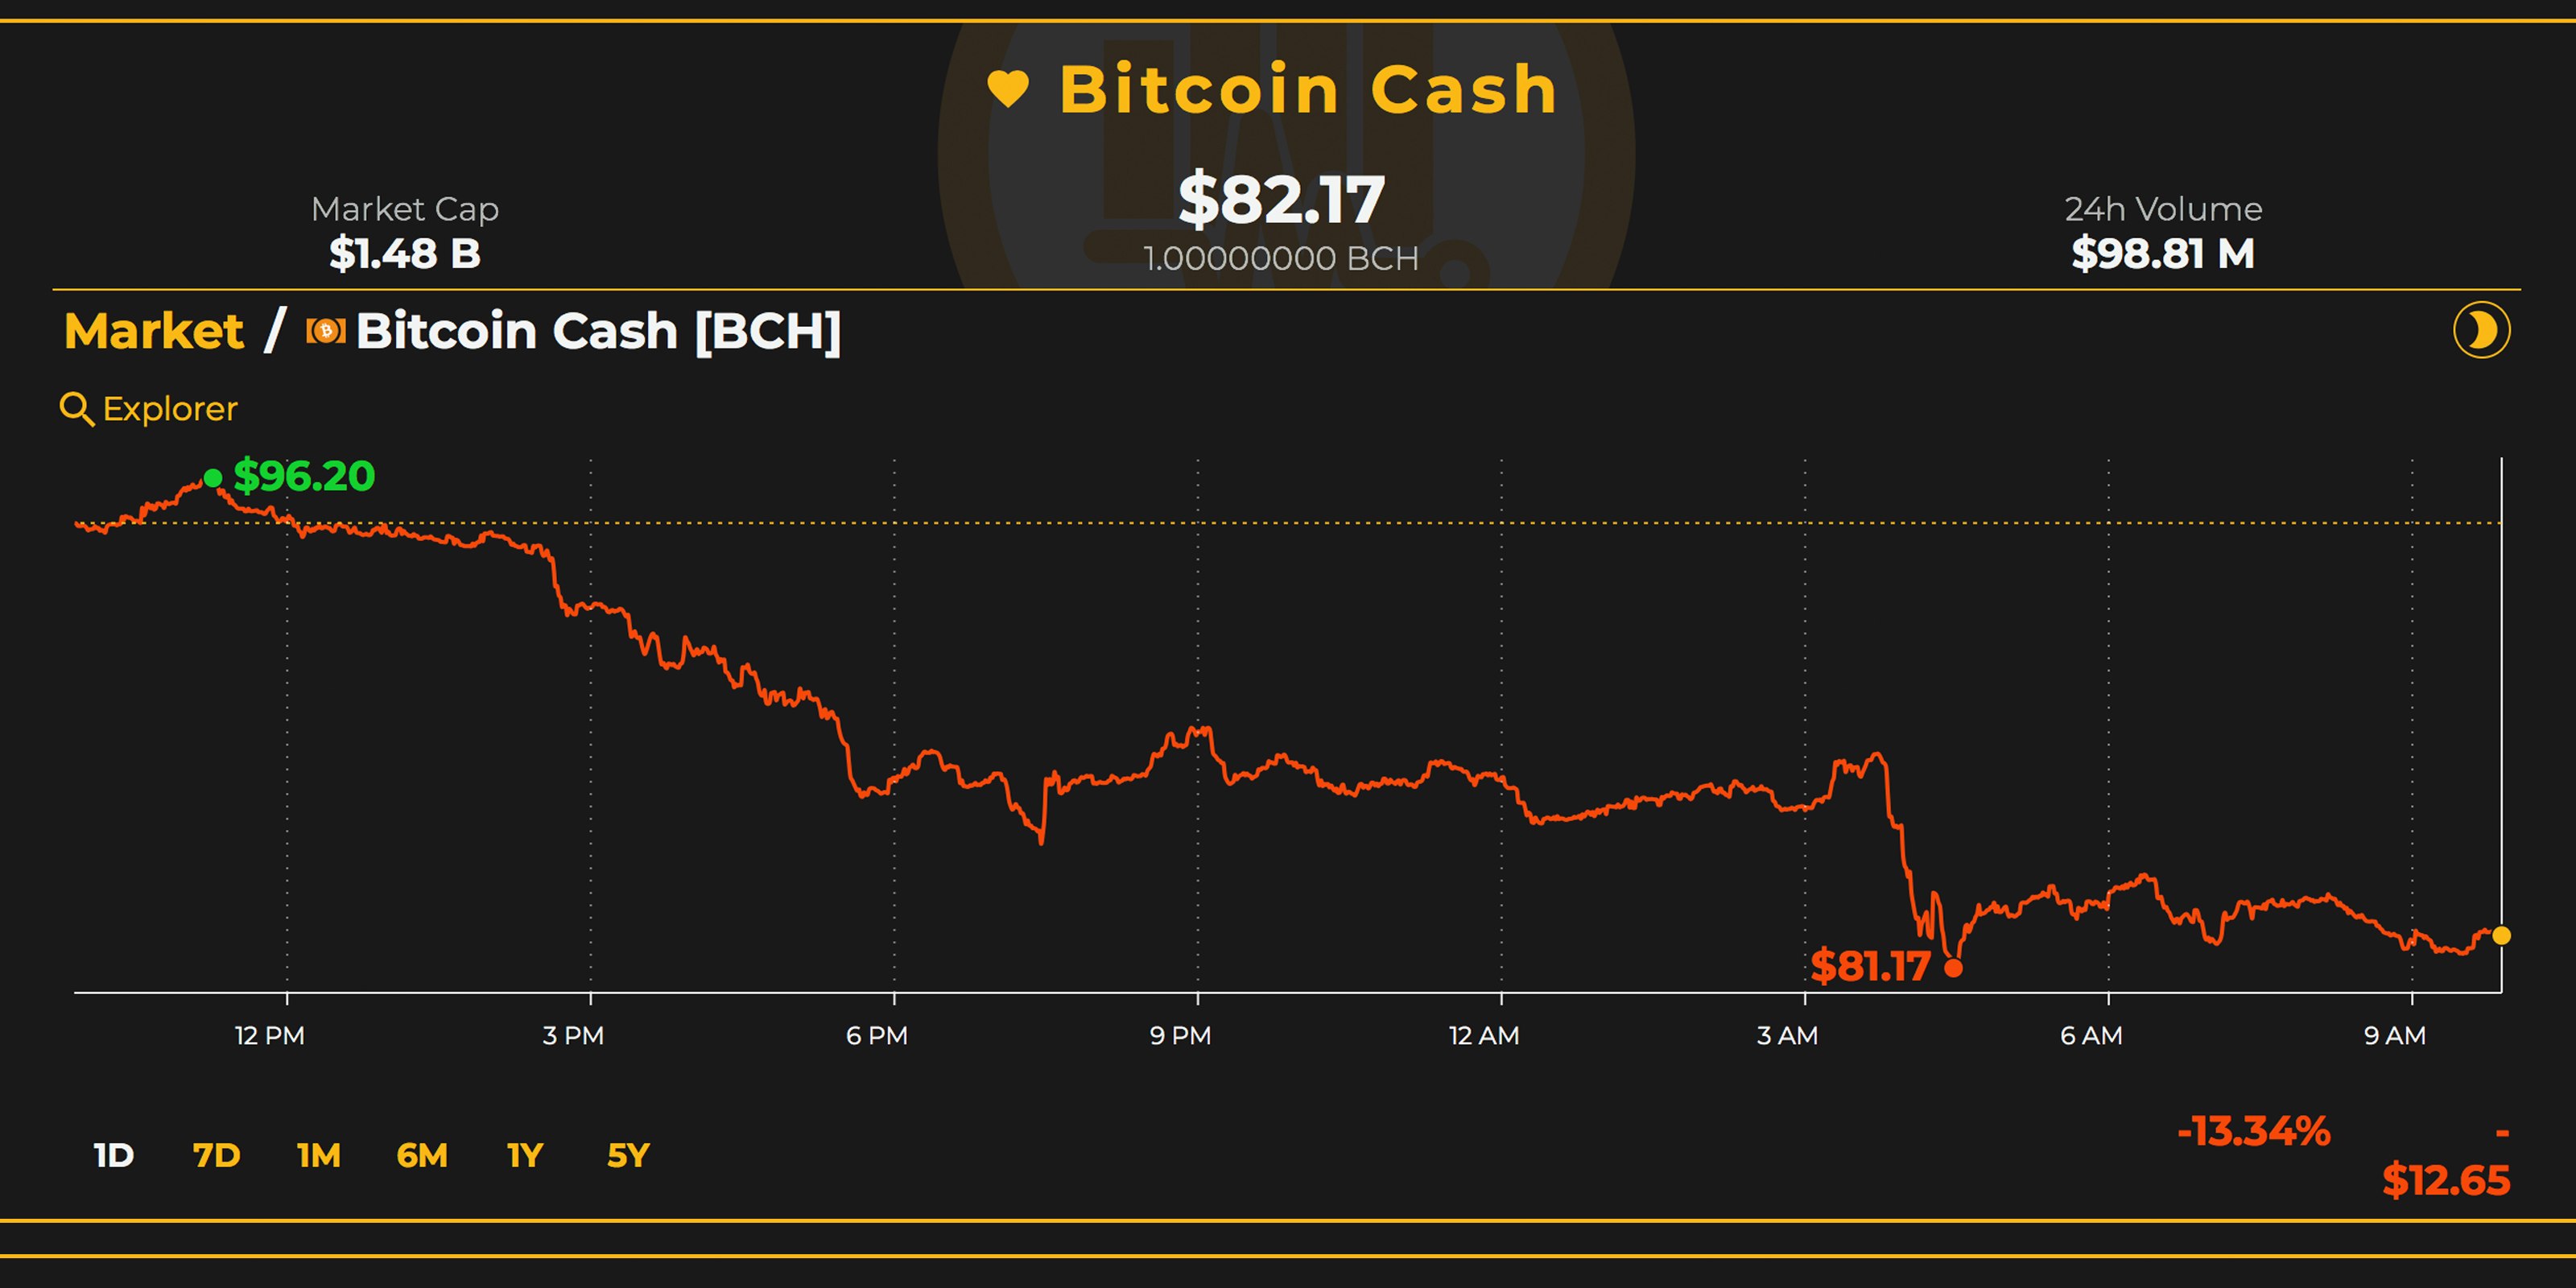
Bitcoin cash (BCH) is the seventh largest market valuation just before the weekend and the entire BCH capitalization is only $1.4 billion. BCH prices during Friday’s trading sessions are down 13% over the last 24 hours and over 18% for the week. This action has given BCH a value of about $82 per coin with roughly $98 million in global trade volume. Bitcoin cash trade volume has increased since our last market update which is a positive sign.

Markets Update: Bears Continue to Drag Cryptocurrency Prices Down
BCH/USD daily chart.

The top five exchanges swapping the most BCH include Lbank, Binance, Kraken, Huobi, and Coinbase. During our last four market updates, ETH had dominated BCH trading pairs over the last few weeks. On Friday, BTC captures the most trades against BCH with 28.5% of global trades. This is followed by ETH (26.5%), USDT (22%), EUR (9%), and USD (6.4%).

BCH/USD Technical Indicators

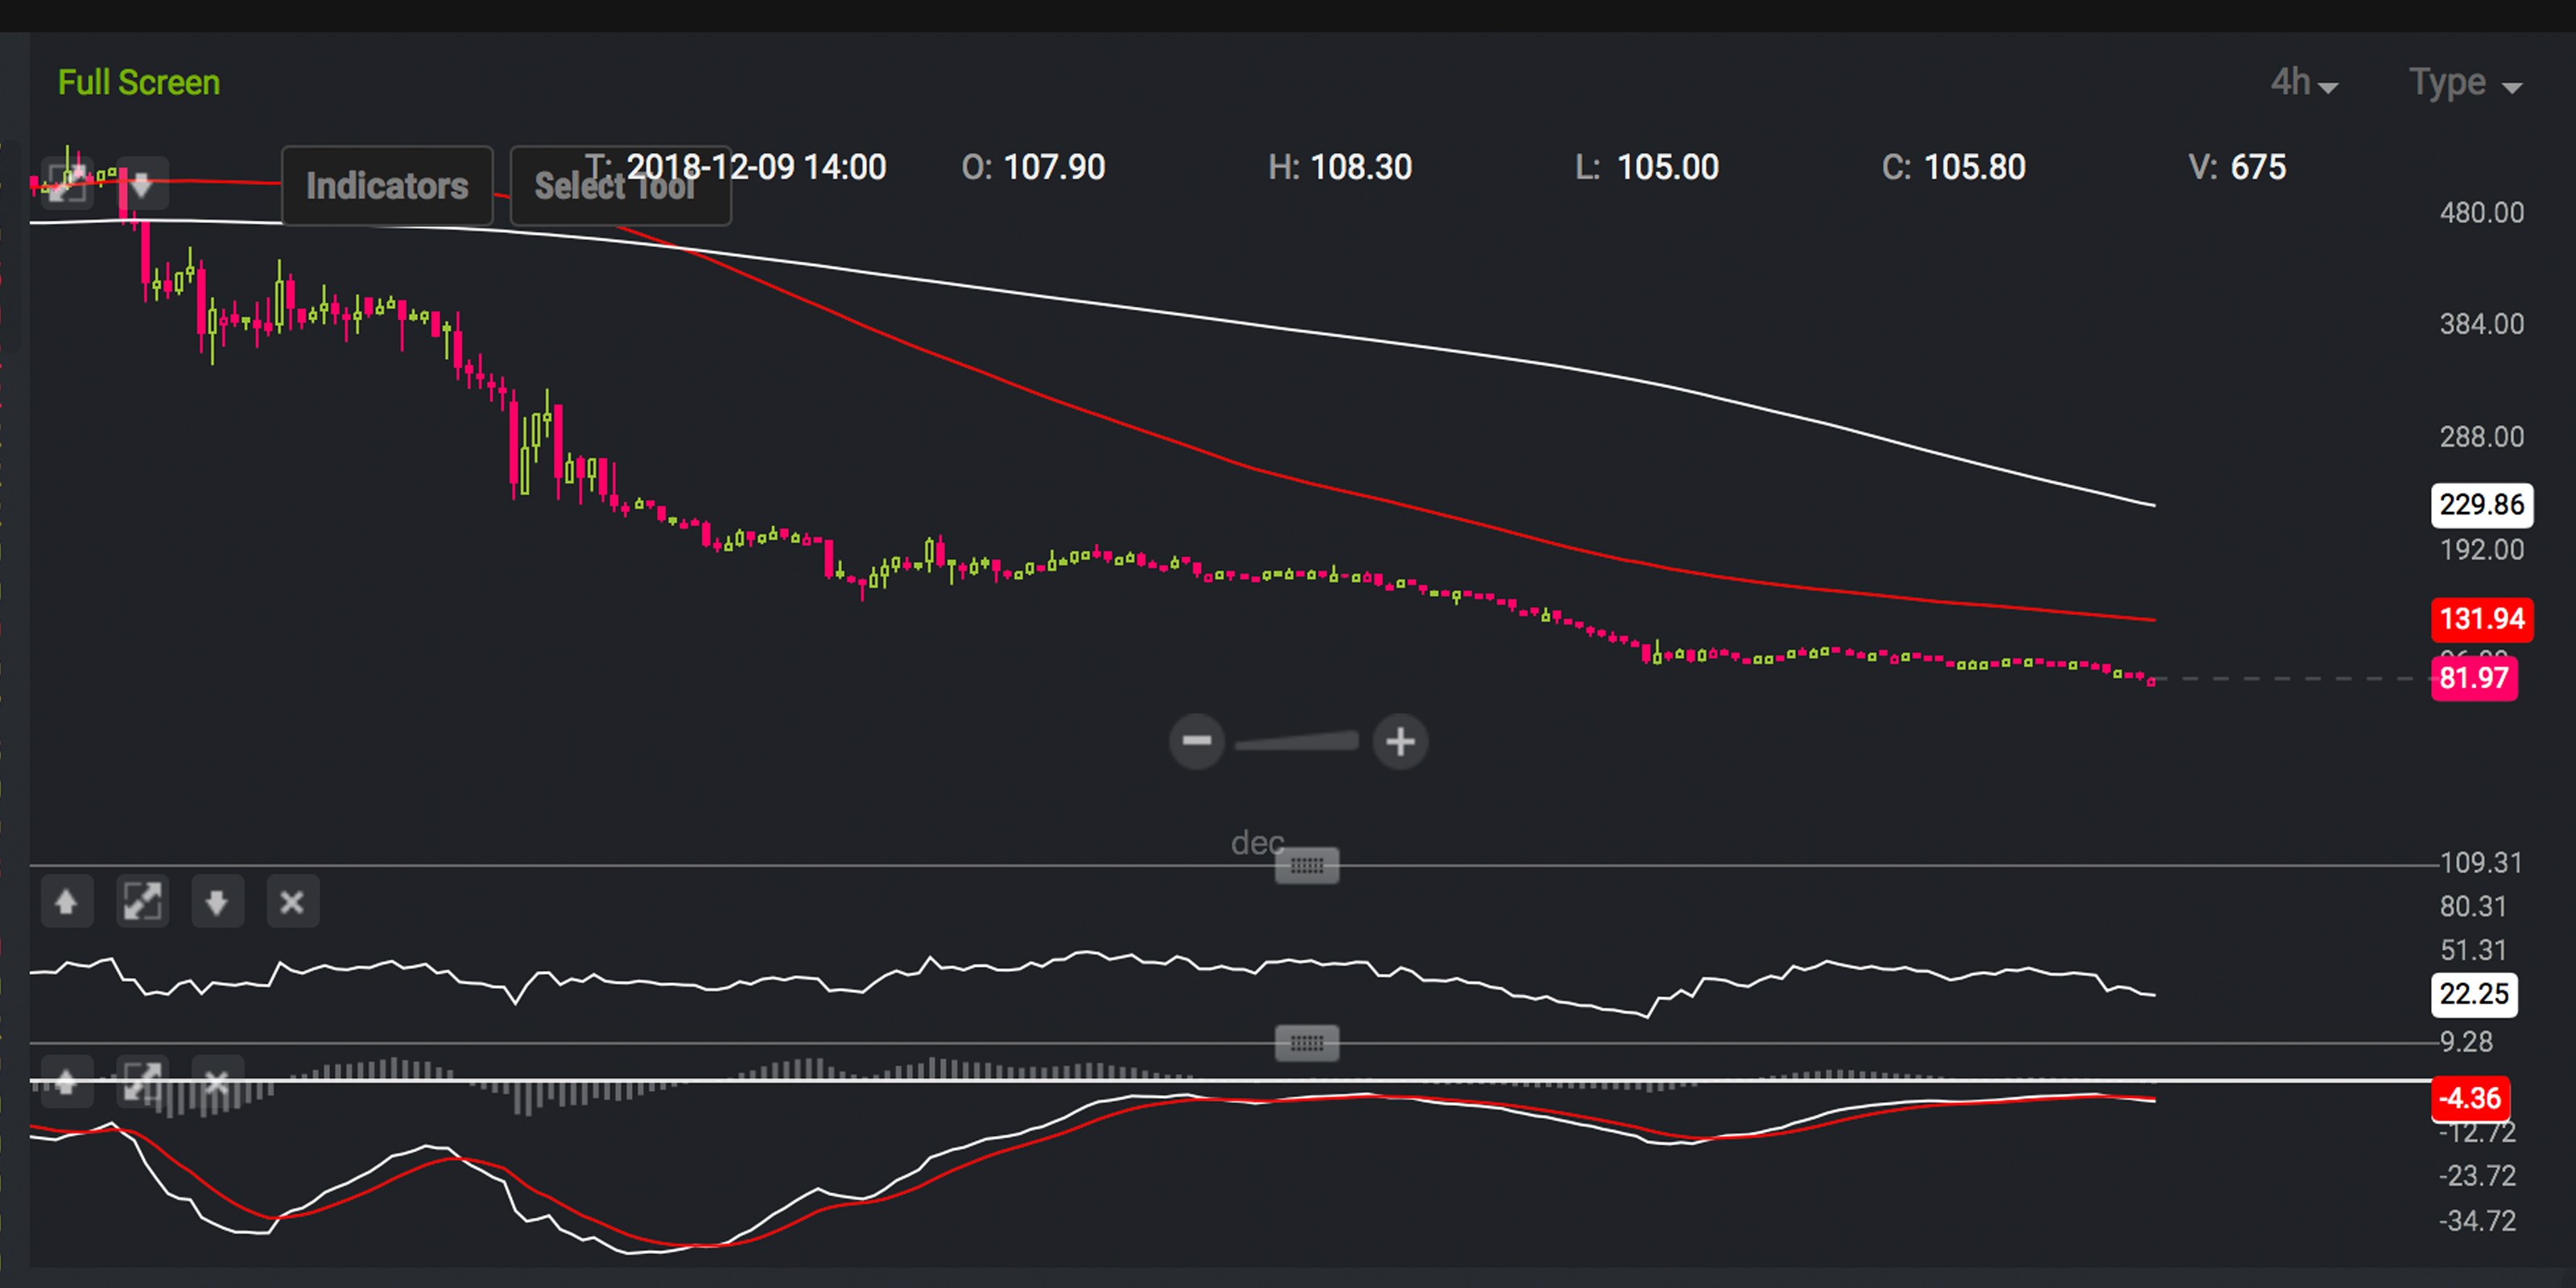
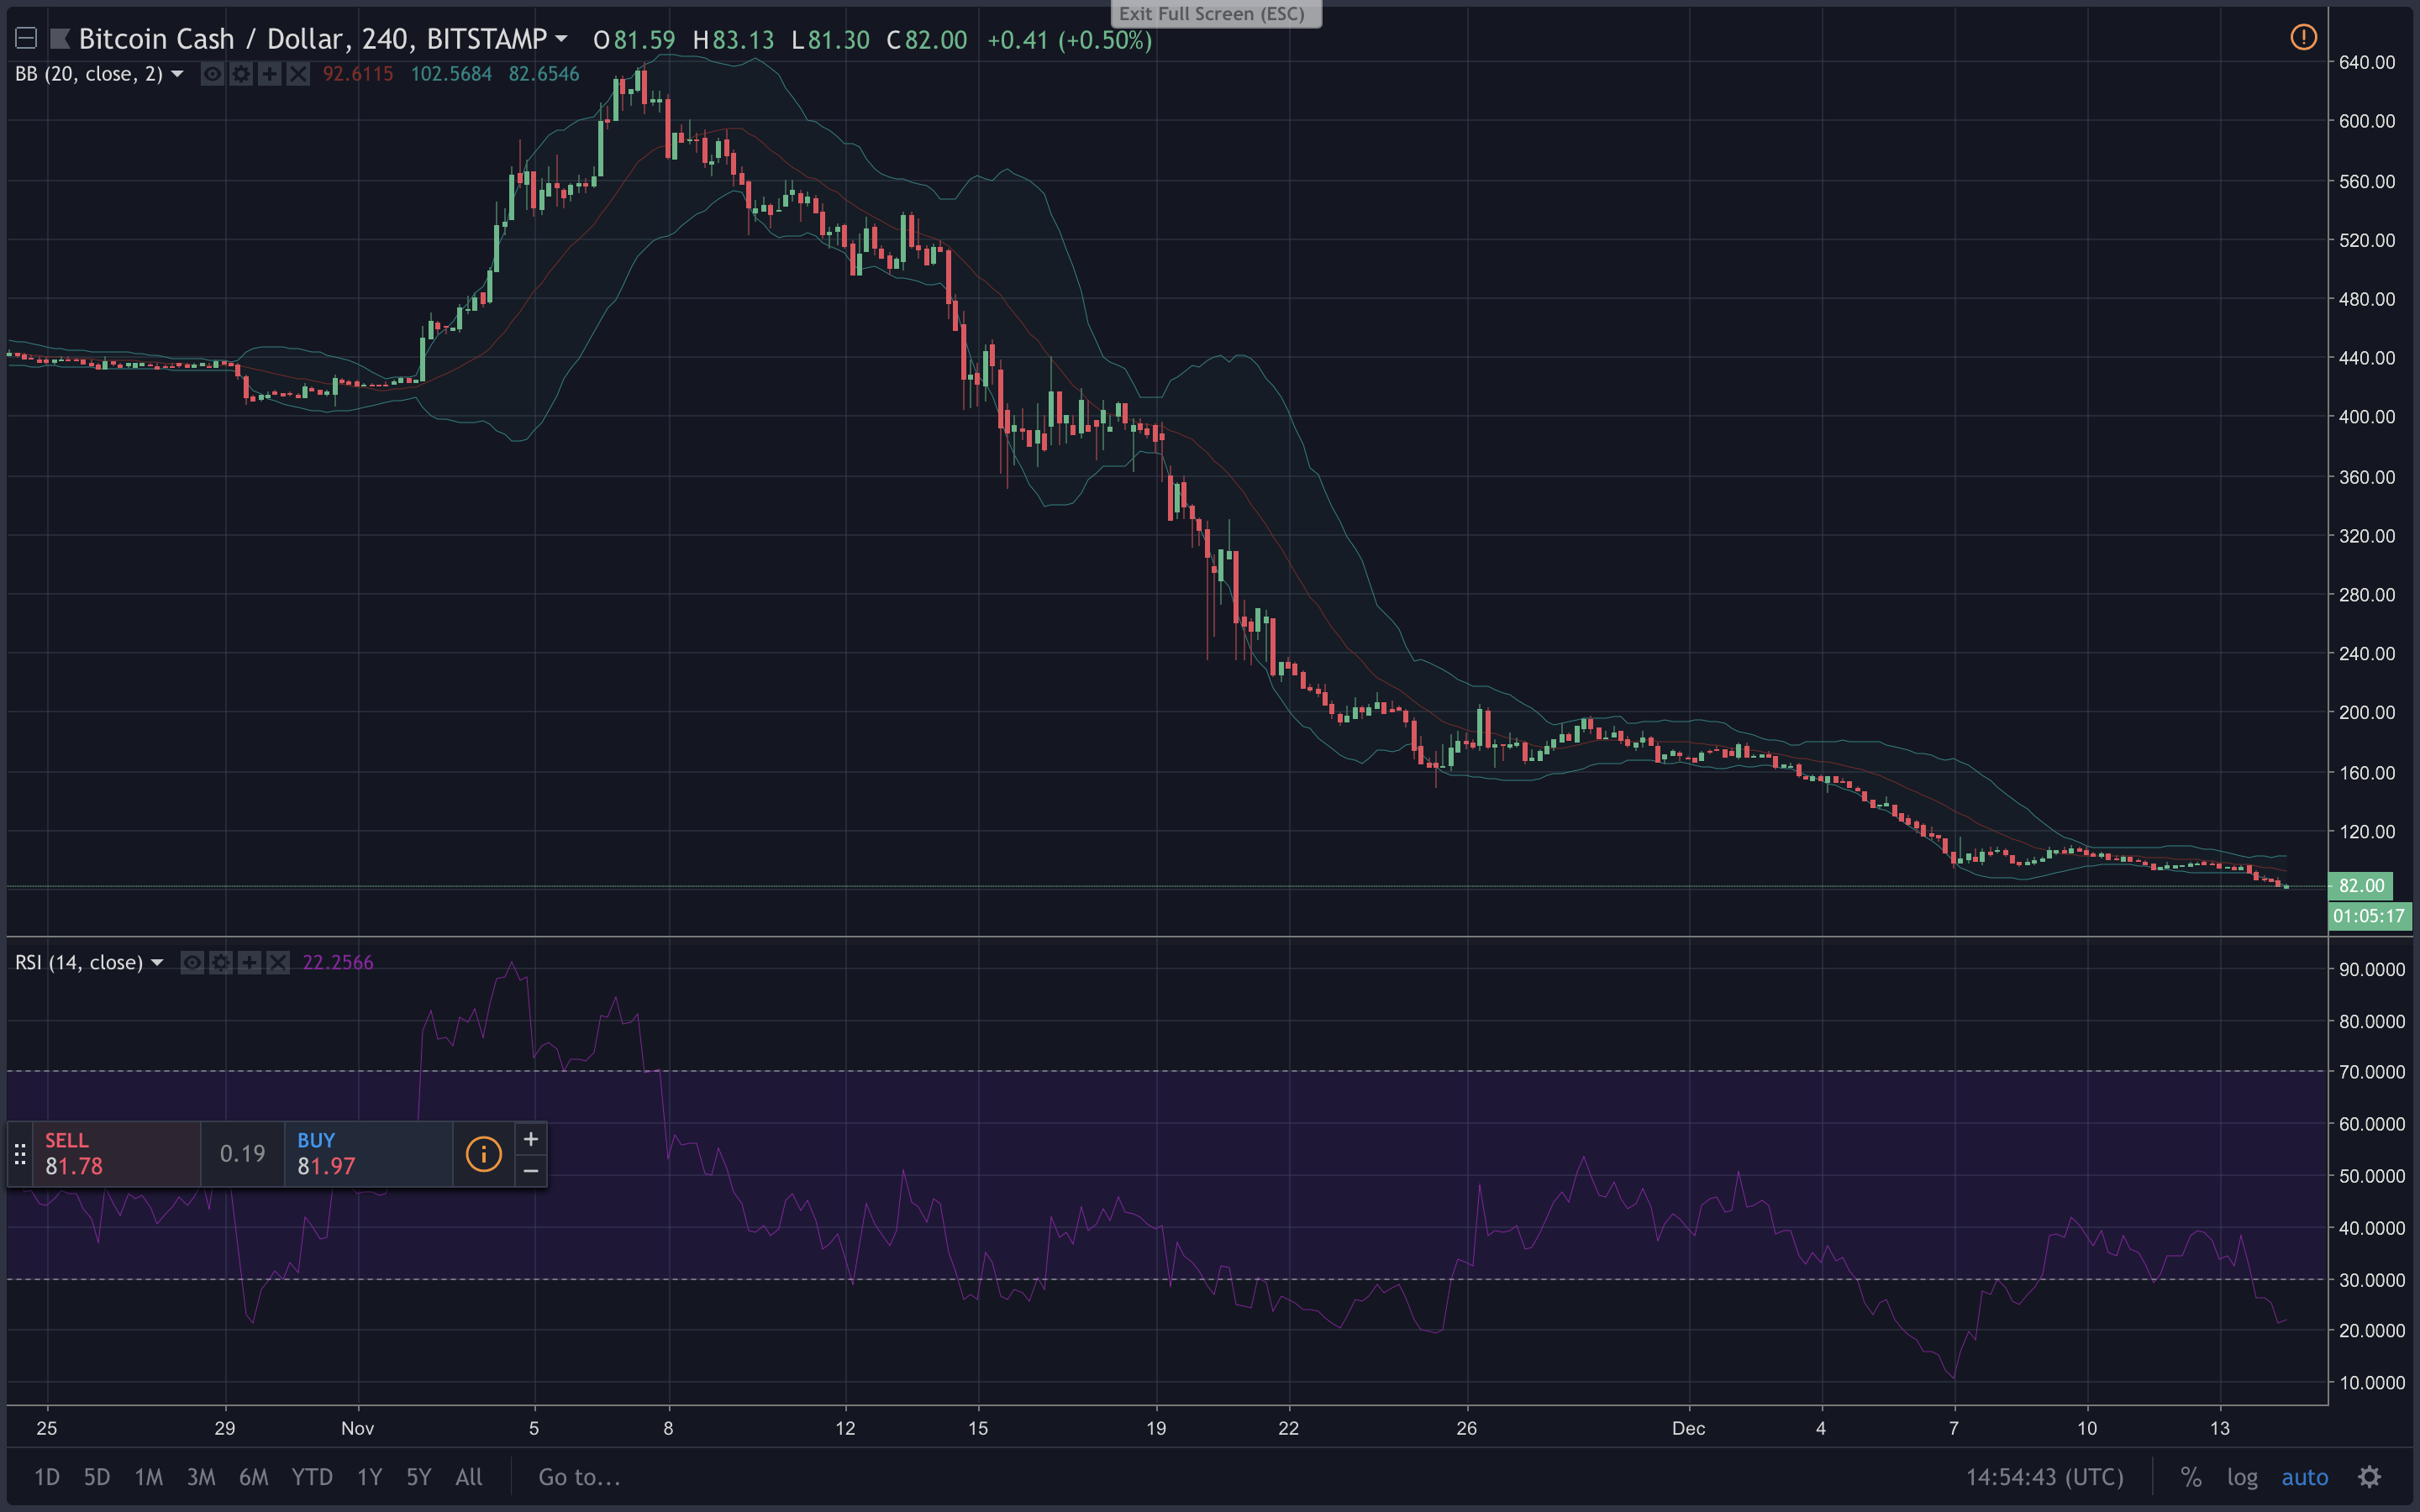
Looking at the BCH/USD 4-hour chart on Bitstamp indicates that bears have the reigns again today. The long-term 200 Simple Moving Average (SMA) is still well above the short-term 100 SMA trend line. This shows that the path towards the least resistance is still very much the downside.

Markets Update: Bears Continue to Drag Cryptocurrency Prices Down
BCH/USD 4-hour Bitstamp.

The Relative Strength Index (RSI ~21.96) is also indicating extremely bearish conditions as the RSI is still showing an oversold market. Stochastic and MACd readings show a similar downside trajectory as there will need to be some surprise bull action to make things less dreary. Order books on the upside show bulls have some resistance from now until $100 and some smoother seas from there. On the backside, support is pretty decent from the current vantage point up to $75 where buy orders start to get slimmer.

Markets Update: Bears Continue to Drag Cryptocurrency Prices Down
Bitstamp BCH/USD trading view 4-hour chart on Dec. 14, 2018.

The Verdict: Uncertainty Remains Strong With Crypto-Markets Below Their 200-Day Averages

This December is showing that cryptocurrency values are not as bright as some people predicted throughout the course of 2018. Being so close to the end of the year, Fundstrat’s Tom Lee has stated that he’s getting “tired” of cryptocurrency price predictions. Lee stated multiple times this year that BTC prices could hit a target of $15,000-25,000 by the year’s end. According to Lee’s note to clients this week, the Fundstrat Global Advisor says BTC’s fair model price should be between $13,800 and $14,800.

“Given we are so close to year-end, we are not providing any updates to near-term price objectives — read this as, we are tired of people asking us about target prices,” explained Lee on Friday.

Lee conceded by adding:

Given the steep discounts of [bitcoin] to our fair value models, the excessive bearish sentiment about fundamentals does not seem warranted.

Lee’s fair market value is still more than $10,000 higher than today’s BTC spot prices. Further, with the price so low BTC/USD, and ETH/USD short positions are still at all-time highs this week. This means more so than ever individuals and organizations believe prices are going to drop again. A large portion of the top digital assets continue to slowly drop into a narrowing price range with no signs of any significant price bounces ahead. As long as BCH, ETH, BTC, and many other coins ride below their 200-day moving averages and show extremely oversold RSI levels, traders will remain skeptical.

Where do you see the price of BCH, BTC and other coins heading from here? Let us know in the comments below.

Disclaimer: Price articles and markets updates are intended for informational purposes only and should not to be considered as trading advice. Neither Bitcoin.com nor the author is responsible for any losses or gains, as the ultimate decision to conduct a trade is made by the reader. Always remember that only those in possession of the private keys are in control of the “money.”


Images via Shutterstock, Trading View, and Satoshi Pulse.


Want to create your own secure cold storage paper wallet? Check our tools section.

Markets Update: BCH Rallies, XRP Nears ETH MarketCap

Markets Update: BCH Rallies, XRP Nears ETH Market Cap

Market Updates

In the cryptocurrency markets, BCH appears to be confirming the recent establishment of a double bottom at approximately $422, preceding bitcoin cash’s rally this past week that culminated in breaking resistance at roughly $600 today. XRP has also produced a strong rally in recent days, with ripple currently appearing poised to overtake ethereum as the second largest cryptocurrency by market capitalization.

Also Read:China Targets ‘Disguised’ ICOs in Crypto Crackdown Update 

BCH Breaks Resistance at $600

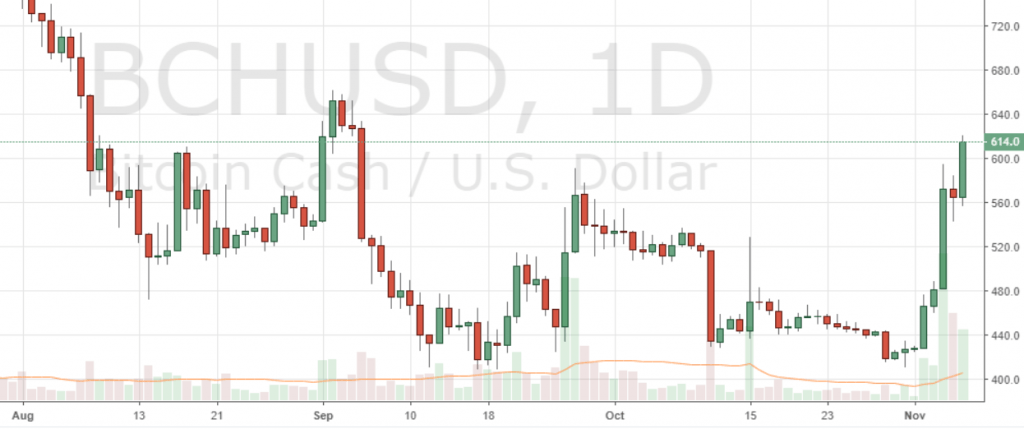
BCH has posted a strong performance this past week, rallying by nearly 50% from a retest of 2018’s low at approximately $410 on Oct. 31st to be currently trading for roughly $615.

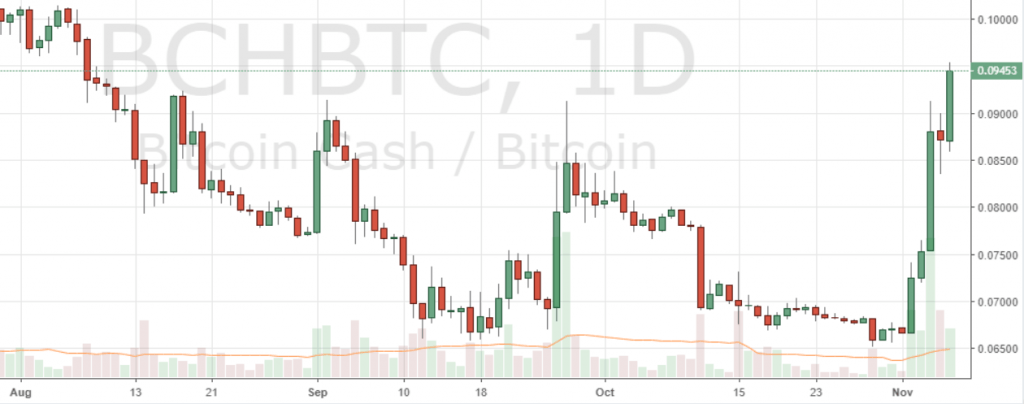
The rally appears to have produced a double bottom ‘W’ formation on both the USD and BTC charts, with price currently establishing a higher high than that posted on Sep. 27 at the highest price posted since Sep. 5 on the BCH/USD daily.

Markets Update: BCH Rallies, XRP Nears ETH Market Cap
BCH/USD – Bitfinex – 1D

When measuring against BTC, BCH is currently trading at the highest price posted since Aug. 9, at roughly 0.0945 BTC after breaking above multi-month resistance at approximately 0.09 BTC.

Markets Update: BCH Rallies, XRP Nears ETH Market Cap
BCH/BTC – Bitfinex – 1D

Bitcoin cash is the fourth largest cryptocurrency by capitalization at $10.4 billion.

XRP Rivals ETH Market Cap

Markets Update: BCH Rallies, XRP Nears ETH Market CapRipple has rallied to rival ethereum as the second largest cryptocurrency by market capitalization for the first time since Sep. 21, with XRP briefly ranking above ETH at approximately 9:00 UTC on Nov. 6. As of this writing, ripple is the third largest cryptocurrency with a market cap of over $21.4 billion, trailing slightly behind ethereum’s roughly $22 billion.
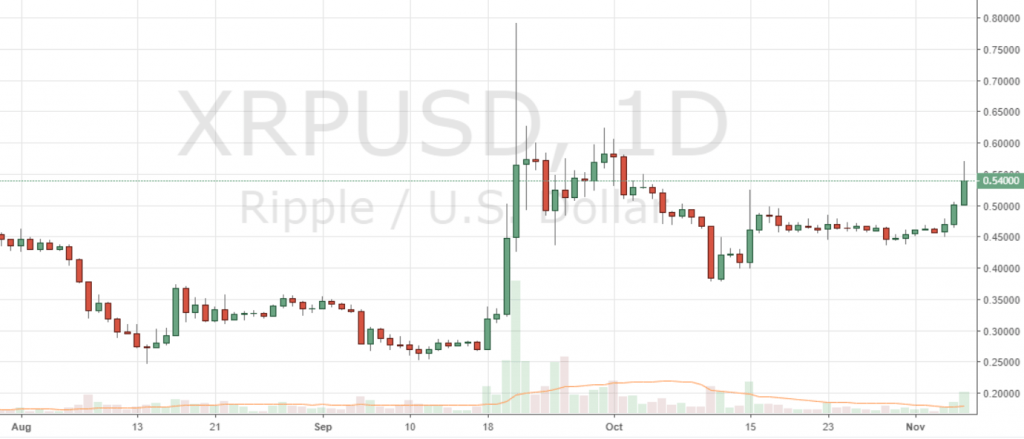
In the last two days, XRP has posted price gains of roughly 15%, with ripple currently trading for approximately $0.54 and 0.0000831 BTC. In the last four hours, XRP rallied as high as $0.568 and 0.0000875 BTC.

Markets Update: BCH Rallies, XRP Nears ETH Market Cap
XRP/USD – Bitfinex – 1D

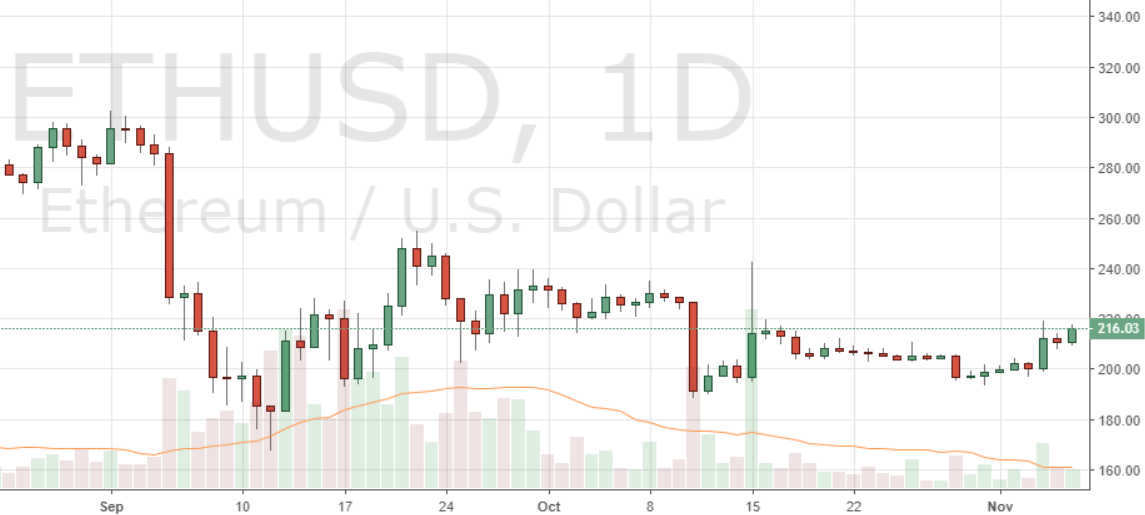
ETH by contrast has been very stable in recent weeks, trading within an approximately 13% range of around $195-$220 for the past three to four weeks when measuring against the dollar. ETH is trading for $216 as of this writing.

Markets Update: BCH Rallies, XRP Nears ETH Market Cap
ETH/USD – Bitfinex – 1D

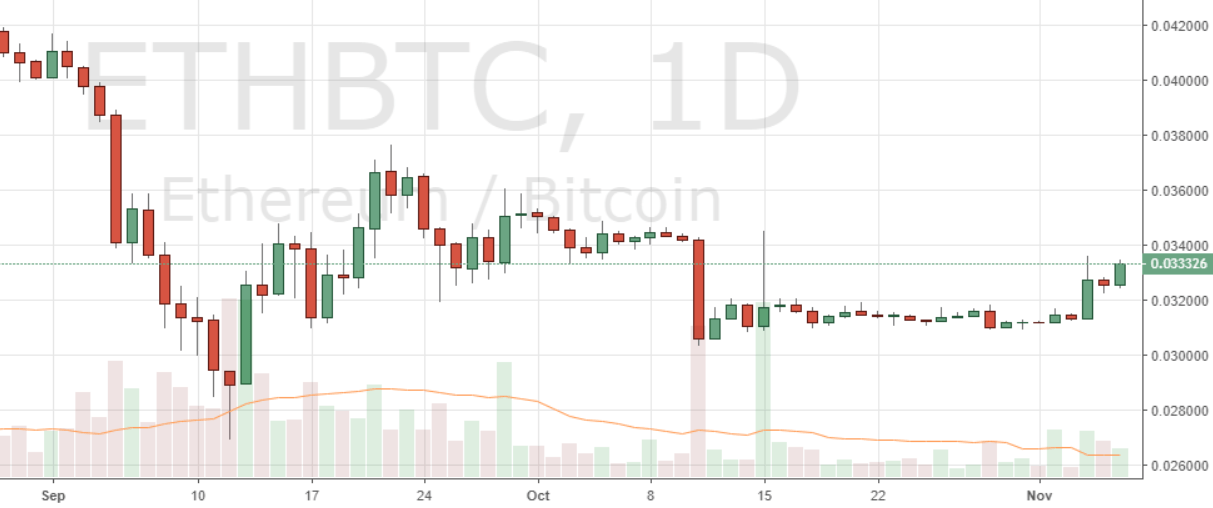
When measuring against BTC, ETH has traded within a range of less than 3% between roughly 0.03083 BTC and 0.032 since Oct. 12, before rallying by 7.2% on Nov. 4 to test resistance at 0.0336. ETH has since consolidated and is trading for roughly 0.0333 BTC as of this writing.

Markets Update: BCH Rallies, XRP Nears ETH Market Cap
ETH/BTC – Bitfinex – 1D

BTC Consolidation Continues

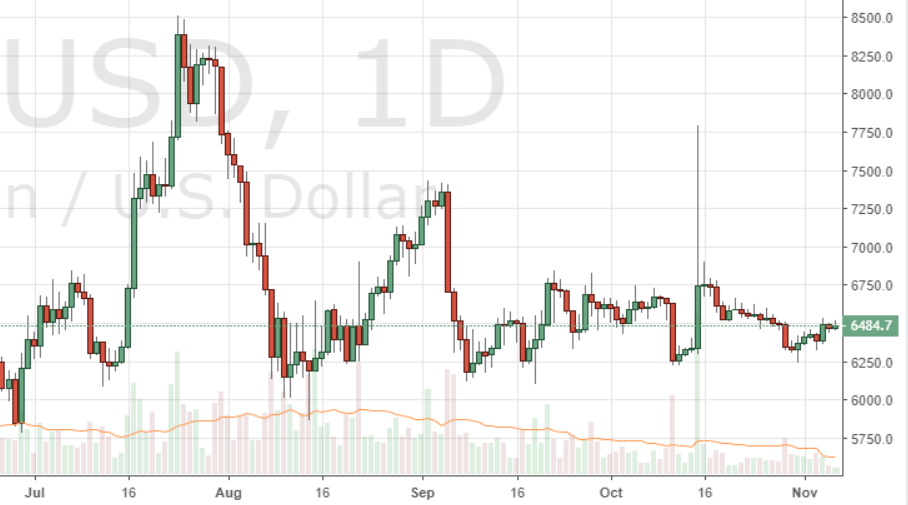
BTC has continued to consolidate within an approximate range of between 10% and 12% since early September, following the posting of the lowest monthly volatility for 2018 at the end of October.

For four weeks the price has hovered between roughly $6,200 and $6,850 on Bitfinex, and between $6,100 and $6,800 on Bitstamp. BTC currently has a market cap of approximately $111.7 billion, and is trading for $6,485 on Bitfinex and $6,430 on Bitstamp.

Markets Update: BCH Rallies, XRP Nears ETH Market Cap
BTC/USD – Bitfinex – 1D

Do you think that Ripple can overtake Ethereum as the second largest crypto market by capitalization for a meaningful length of time? Share your thoughts in the comments section below!


Images courtesy of Shutterstock, Tradingview


The Bitcoin universe is vast. So is Bitcoin.com. Check our Wiki, where you can learn everything you were afraid to ask. Or read our news coverage to stay up to date on the latest. Or delve into statistics on our helpful tools page.